Many fall in the face of chaos, but not this one, not today
- 18 Posts
- 32 Comments
I know a Thomas too! He’s the straight cis eye of a queer hurricane. And it wasn’t always this way, he just keeps pulling folks into his massive orbit. Folks who later realize they are queer. He never brings it up or even seems to notice.
I finally realized what’s going on and it’s just a little weird. Like, what the hell is going on? Do my friends even have free will?! Do I?!
I conclude that Thomas has such a pure heart and loves so freely that he innervates people with restless souls. They/we are drawn to this vibe like planets in his solar orbit.
I should write him a poem about this
Thomas’ pure heart
Orbit for expanding souls
A queer hurricane
Whoa this song absolutely slaps. I’m so glad you posted this!
Yeah, TBF I was really just making a snarky dig at the misogyny in the evangelical world.
I can immediately think of a counter example: the Golden Compass. It’s written by a man, but basically takes the stance that the devil is the good guy and has a main character whose best skill is the ability to lie so well she can pretty much always get what she wants. The church equivalent abuses children and looks the other way about it when confronted 💀
Unsurprisingly that series isn’t too popular among fundies
Witchcraft is fine. Every evangelical I know was allowed to read Hobbit, LOTR, Dune, Narnia.
The problem is witchcraft written by women

 0·3 months ago
This is great, thanks!
It’s my first playthrough and my makes my heart feel big feels. Also makes my blood pressure skyrocket. That wind level had me so tense, but then the feather came out and I was like who is cutting onions in here
I used to get nauseous every morning for no reason. I still do, but now I have a reason
 13·3 months ago
Thanks for getting me to laugh this early
one ma’am’s trash music is another’s treasure
YOU SPIN ME RIGHT ROUND BABY RIGHT ROUND
Mmmm more curves, less muscles, all pillar
JOJO, ZE PILLARMAN, IT IZ AVAKE!
pillarman strikes a majestic pose, 8 pack abs rippling
Let’s not overlook the weed porch

I love me some Linux, but I’m going to need an explaining, that’s a little deep of a cut for me.
 18·5 months ago
Definitely include a graph of shareholder value overlayed on top.
Sarcasm aside, maybe we should have a graph that also shows:
- average hours worked a year
- average number of sunsets a person sees before they die
- average hours spent with loved ones per year
- average rent
- average hours worked to pay for groceries
- average hours spent doomscrolling on social media
- average student loan debt payments
- suicide rate
- average zoom calls a year
- happiness
And see that by basically all metrics we are working more, paid less, more depressed, more stressed, and unhappy.
“get outta here”
“No really I’m bleeding out”
“That’s messed up”
Oh man, I live deep in Wawa country, just a few miles from their headquarters. Everyone I know gets 90% of their food from Wawa, it’s wild.
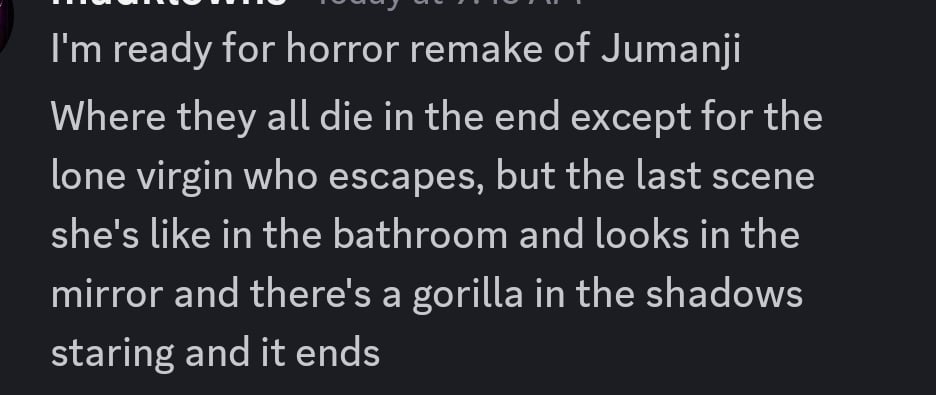
Hmmm good point but they all survive at the end, so I’d classify it as a traumatizing and disturbing action movie

Made this just for you, red hot off the press
This is fantastic. Goated with the sauce indeed

Here’s an online calculator
https://webfce.com/bri-calculator/